Archives

  • Ben Feggans on Loudness – Part 2

    Ben Feggans on Loudness – Part 2

    Loudness Part 2

    In the second part of this blog on loudness I’m going to delve more into metering and dynamic range in order to compare your music to other releases.

    Level Matching

    I often receive feedback from people that their track doesn’t sound like it has the same low end impact and presence as others. Quite often this is due to one aspect- the track they are comparing to is louder. Because of the way our ears perceive high and low frequencies, even a tiny 0.5-1dB difference will make the louder track appear to have more bass and top end, making it sound a little clearer and fuller – or slightly better, in most people’s opinion. If you want to make a fair comparison, you have to level match. Doing this, you may find that the track you are comparing to may actually sound worse.

    Level matching is paramount in mastering when comparing your processed mix to the unprocessed mix. Incorrect or heavy handed processing will result in the mastered track sounding ‘smaller’ than the un-mastered track when level matched, especially noticeable by comparing the chorus or build-up of the track. When the chorus comes in the processing becomes even more apparent as it clamps down on the track. Using level matched A/B comparisons is the best way to check when your processing is improving the sound rather than just making it louder.

    Peak and RMS metering

    Loudness metering is generally done by a combination of ear and average level metering, such as the VU metering in Leon’s blog [link]. All software DAWs employ peak level metering to let you know about digital overs, which is very important to avoid clipping the signal, but will not give an indication of perceived loudness. Many also have average (RMS) metering now as well, emulating the VU meters found on analogue consoles. As they were traditionally mechanical, The VU metering rise time is slower than a digital Peak Programme meter (PPM), so the VU meter will represent an ‘average’ level rather than the instantaneous peaks, making the VU meter a more accurate representation of the perceived loudness. This is how people mix in the analogue world on a console.

    All good so far, but what happens if you have a huge kick drum that dominates the mix? A low frequency high level sound wave will push the average level right up and your metering will ‘ping’ off the stops, yet as we learnt in part one [link], this does not necessarily mean it’s loud- you have to take the frequency balance into account. A big 60Hz sine wave will have huge RMS level, yet many speakers will struggle to produce this and you have just eaten up your entire spectrum.

    When mixing, the PPM will show you the transients (like snare hits), and the VU will show you the average (RMS) level. If the average level is very high on certain bass notes or the kick drum, this is eating up all your available headroom and not letting the higher frequencies cut through, so you will lose clarity and impact. Try having more consistent energy in the sub region, and if you want a big sub, place that sound in isolation from other sounds in your arrangement. Use the PPM meters for transients. Again, try to keep these at a more consistent level so your transients don’t lose impact after peak limiting. Many meters now incorporate peak and RMS metering to help with mixing.

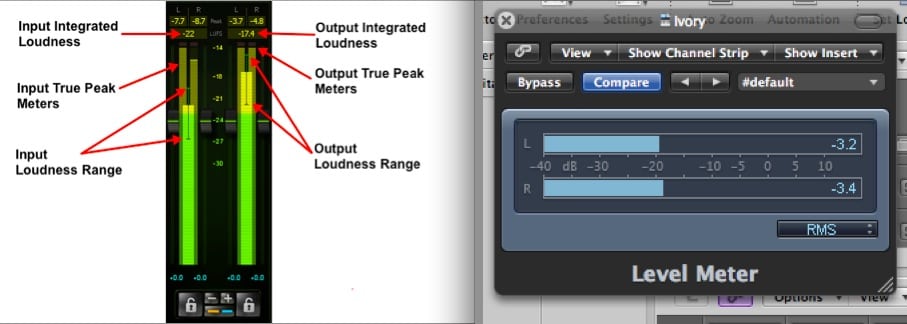
    Level Meters

    Dynamic Range

    This brings us to Dynamic Range. Dynamic range is the measurement between the minimum and maximum volume level, given in decibels (dB). The dynamic range of human hearing is around 140dB- This is from the threshold of human hearing to a jet engine. The dynamic range is directly related to the audio bit rate, for each bit you will theoretically get 6dB of dynamic range. So CD quality is 16 x 6 = 96dB.

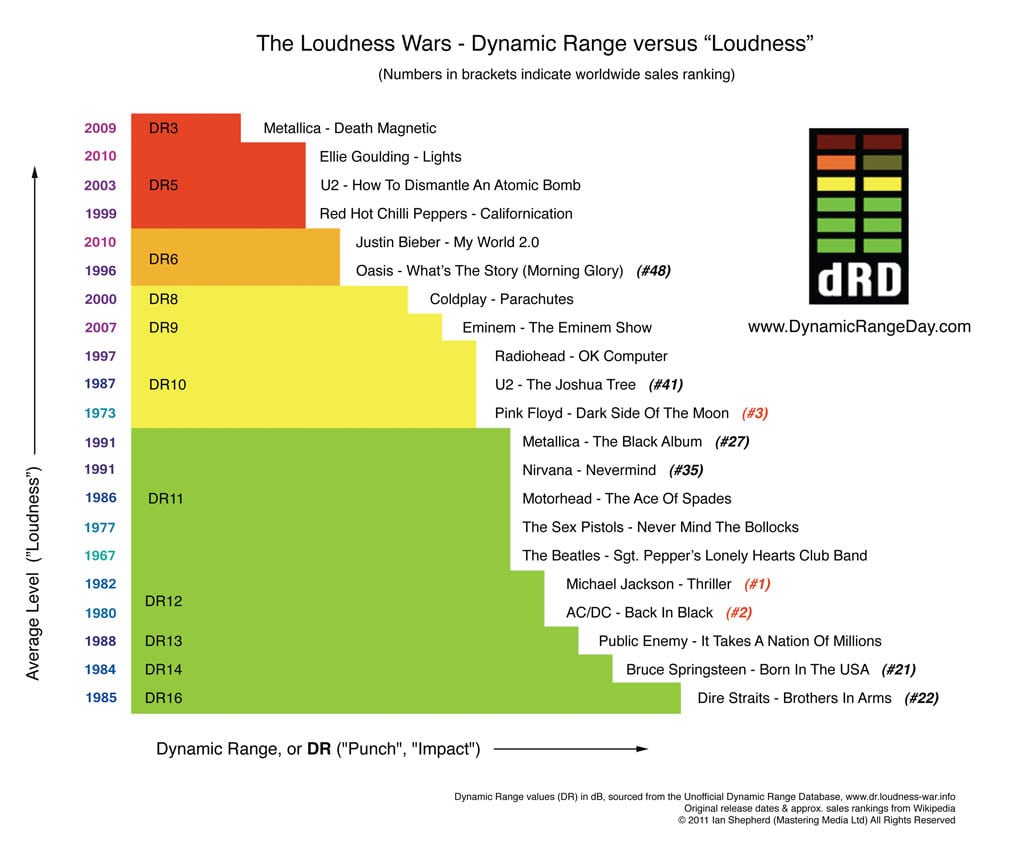
    In the past, the dynamic range was limited by the recording medium (see chart). In order to fit record sources with a high dynamic range, such as an orchestra, the dynamic range had to be reduced. However, if you are reducing the dynamic range you are also reducing the impact of the sound. So the orchestra recording with a small dynamic range will have much less crescendo impact, due to the difference between the quiet and loud passages being reduced.

    dynamic range chart

    Looking at the dynamic range chart, storage media has increased in dynamic range by up to 30dB since cassette. Yet modern releases have been reduced in dynamic range by using excessive compression, peak limiting and clipping for loudness.

    Now consumers are becoming more aware of this, and as you may have noticed, many artists are bringing back dynamic range into their masters with great success. You can search the Dynamic Range Database for your favourite artist here http://dr.loudness-war.info/

    Loudness Metering

    The latest loudness measuring tools take into account short term loudness, long term loudness, and frequency perception to give you a loudness number. There are many standards for metering, but the most common are EBU 128 and ITU BS.1770. Many software DAWs and mastering tools such as Ozone now have loudness metering standard.

    Here are a few meters that you can use in your DAW:

    http://www.meldaproduction.com/plugins/product.php?id=MLoudnessAnalyzer

    http://www.nugenaudio.com/vislm-loudness-meter-plugin-standalone-application-aax-au-vst_11

    http://www.orban-europe.com/products/data/lmeter/supp_loudmeter_1.html

    http://www.tcelectronic.com/lm2-plug-in/

    Sequoia is designed for mastering and includes loudness metering.
    Sequoia is designed for mastering and includes loudness metering.

    EBU 128 will give you an Loudness units relative to Full Scale (orLUFS) reading and ITU BS.1770 will give you an Loudness, K-weighted, relative to Full Scale (orLKFS) reading. Without getting too technical they are essentially the same except for the gate time. What you are looking for is the integrated loudness. Using loudness metering will assist you in making accurate A/B comparisons. Another advantage of proper loudness metering is the TP max (True Peak Max) number. This will alert you if the intersample peaks will overload a poor quality DAC or lossy encoder.

    NUGEN VisLM is an excellent loudness tool
    NUGEN VisLM is an excellent loudness tool

    Conclusion

    I know, I know, you want your track to be louder than everyone else’s. Maybe because I work as a mastering engineer you are thinking I have a secret technique for loudness. In reality it mostly comes down to the mix. Mastering should enhance what is already there, and not change the mix drastically in the pursuit of loudness. Keep in mind that a good song will still sell regardless of how loud it is. Hopefully in these two articles I’ve demonstrated that loudness is a delicate combination of frequency balance, dynamic range, and the arrangement of your mix. If you are pushing for level and your mix falls apart, then your track has reached its “loudness potential”.

    Written by Ben Feggans.
    Ben Feggans - 301 Mastering

    Ben is one of our 5 resident mastering engineers, and works in Mastering Suite 2.

    To book Ben Feggans for a mastering session, contact Lynley via mastering@studios301.com or 02 9698 5888.
  • Ben Feggans on Loudness – Part 1

    Ben Feggans on Loudness – Part 1


    Loudness Part 1

    One of the most common questions people ask a mastering engineer is “why is my track not as loud as everyone else’s?”

    In this article I’m going to explain in simple terms how humans perceive loudness and how it can be measured accurately.  Since the early Motown days of pressing vinyl, there has always been a race to have the loudest cut. This was a skill developed by cutting engineers and is the foundation of mastering records. The idea being that the song would sound louder on a juke box and on the radio thus making it stand out from the rest. The loud cut was limited by the physical medium of the record and the cutting head.

    When digital came along this all changed- there is a ceiling of 0 dBFS (decibel Full Scale) that is the maximum permissible limit of digital audio. Since the introduction of digital peak limiting and clipping in the 1990s the true “Loudness War” began, much to the detriment of listener enjoyment.

    The Loudness Wars

    Also see here another Visual History of Loudness.

    Television stations have been following loudness guidelines for years due to the many listener complaints that the ads were louder than the program content. In America this is known as the CALM act, and Australia is moving in a similar direction with OP59 standard. Most audio people know that the ads are louder do to the decrease in dynamic range of the ads compared to the normal program. Program audio has dialogue, music and background sounds so it needs to have some dynamic range in order to sound natural and also have impact for action scenes, whilst the ad is smashed to an inch of its life so the quiet parts are almost the same level as the loudest part.

    Measuring loudness is quite difficult, and due to changing standards for television, accurate loudness metering has only recently been developed. Fortunately the same way of measuring loudness for broadcast is creeping into music, so when you tick Apple “Sound check” or Spotify’s “normalize” function the level of music is will remain consistent from track to track. This will be a revelation for the music industry and may put an end to the loudness war, as tracks mastered purely for loudness will actually sound worse when volume matched to music mastered at a more conservative level.

    Human Perception

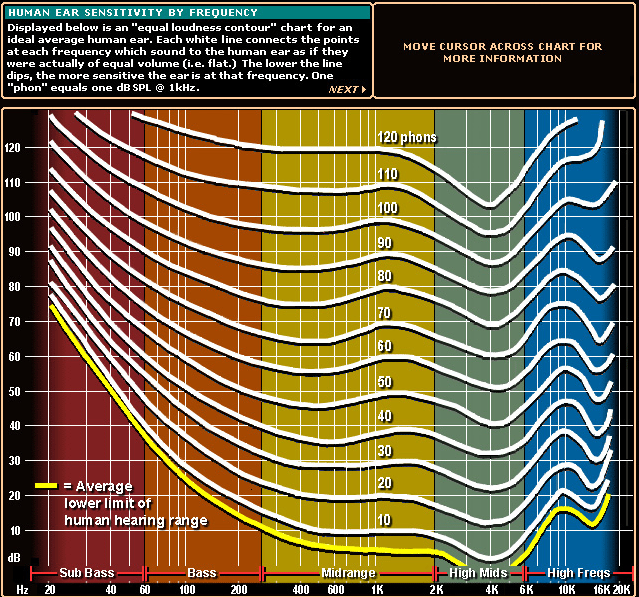
    Sound has two properties, wavelength and amplitude. The frequency of the wavelength is measured in Hertz (Hz), and sound pressure level (SPL) is measured in Decibels (dB). The human ear of a small child can hear from 20Hz to 20kHz, and the high frequency response decreases with age and more rapidly with loud noise exposure. Just talk to a live sound engineer over dinner and you’ll get my drift. What many people don’t know is that humans do not hear the entire frequency range at the same loudness level. Furthermore; as amplitude changes, so does our ears response to the frequency spectrum.To understand why different frequencies are not heard equally, you’ll have to look at the research by Fletcher and Munson reported in a  paper entitled “Loudness, its definition, measurement and calculation.”

    The Y-axis represents Sound Pressure Level (dB SPL) or volume, in simple terms. The X-axis represents the frequency range. As you can see, our ears are most responsive to the middle range of the frequency spectrum around 1kHz-4kHz range right where human speech is. At lower volumes our ear does not hear the low or the high frequencies and well as the midrange. At higher volumes the curve begins to flatten out and we begin to hear a flatter frequency response compared to lower levels. The flattest response is around 85dB SPL, which is also about as loud as you should have your monitoring for 8 hours to avoid hearing damage.

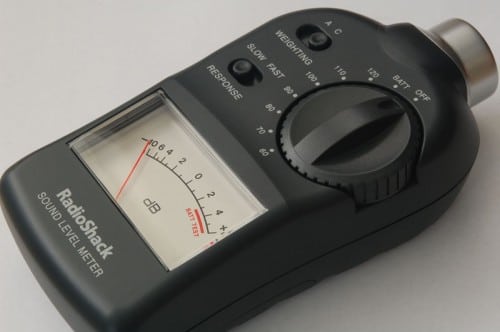
    spl-meter-500x332
    an SPL meter.

    Grab an SPL meter from Jaycar, which should set you back $40 and sit in an equilateral triangle between your monitors. Ensure your monitors are away from wall and the corners of the room or you will have an inaccurate boost in the bass response. Put the meter on C weighting and play some pink noise from your DAW at -18dBFS. Once you are around 85dB SPL this is your listening reference level. You can even measure your room frequency response if by downloading test tones http://realtraps.com/test-cd.htm

    Frequency Balance

    What does this have to do with music loudness? Think about the different frequencies of instruments in your mix and where they sit in the audio spectrum. Here is an excellent frequency range chart that can also show you how each range is related to our hearing response:

    More here: http://www.independentrecording.net

    Equal loudness

    When people say to me “why is my track not as loud as everyone else’s” I point them to the mix, not the mastering. I’ve noticed over the years as clients mixes improve (meaning, they both sounded better in the control room AND in the real world), they also become louder.

    Look at it like this: if you’re mixing a hard rock tune, and your guitar and bass are masking your kick and snare, you need to turn the kick and snare up louder to give them the impact you need. That means transient material that is louder relative to the more steady-state (RMS) stuff. And that means a quieter mix. Now, if you carve out some low end from the bass that allows the kick to speak with impact at a lower fader level, and carve out some midrange from the guitar that lets the snare speak at a lower fader level, your transient-to-steady-state (peak-to-RMS) level will be lower, meaning a louder mix. You will also have better separation.

    rayburn

    Then you’ll find that when the track is mastered and pushed to commercial loudness levels, the mix balances don’t fall apart, compared to an average mix that is pushed too hard. A word of warning though- as our ears are most sensitive to midrange, this is the area that can become unpleasant with excessive midrange boost.

    The loudness of your mix mostly comes down to the frequency balance and where the spectral energy is. It also comes down to dynamic range, which I will discuss in part 2. The older VU meters and average level meters (RMS) will react strongly to low end, giving you a false representation how loud your mix is compared to others. Loudness meters take the way we hear into consideration with weighting filters and will give you a much more accurate number.

    More on this in part 2 in the coming weeks!

    Written by Ben Feggans.

    Ben Feggans - 301 Mastering

    Ben is one of our 5 resident mastering engineers, and works in Mastering Suite 2.

    To book Ben Feggans for a mastering session, contact Lynley via mastering@studios301.com or 02 9698 5888.